Prepare for an insightful journey into the evolving realm of social media with our exploration of key Instagram statistics for 2025. Instagram continues to grow, notably by expanding its shopping features and introducing Reels, further cementing its status as a leading social media platform globally.
For professionals in social media, staying abreast of current trends is not just advantageous but essential. In our pursuit to provide valuable insights, we have meticulously curated information from various online sources, presenting a well-researched and reference-rich compilation.
Our approach includes analysis from global studies like the Digital Report, as well as insights from region-specific research. This website acts as a dynamic resource, frequently updated to keep you not just informed but also ahead in the rapidly changing social media landscape.
This compilation offers intriguing Instagram facts and statistics that might initially seem trivial, yet they are crucial in understanding the platform’s upward trajectory in the social media world.
By leveraging the latest Instagram analytics and trends, our social media marketing services enhance their clients’ brand presence, engage more effectively with their audience, and achieve measurable growth in the market.
General Instagram Statistics
- Instagram’s co-founder Kevin Systrom took the first photo ever shared on the platform, depicting a dog near a taco cart.
- Instagram is the second most downloaded free app on the Apple App Store, with over 1 billion monthly users, ranking as the fourth most popular social networking site worldwide.
- Users spend an average of 53 minutes per day on Instagram, close to Facebook users’ average of 58 minutes.
- Approximately 25% of smartphone users are active on Instagram, highlighting its significance in the social media sphere.
- The hashtag #Love is predominant on Instagram, used an astonishing 1.7 billion times.
- Since its inception, over 50 billion images have been shared on Instagram, constituting 71.9% of all posts.
- Videos and carousels account for 14.2% and 13.9% of all posts, respectively.
- Instagram has hidden like counts in seven countries: Australia, Brazil, Canada, Ireland, Italy, Japan, and New Zealand.
- A significant 62% of users log in daily, with 42% checking their accounts multiple times, leading to the Like button being hit 4.2 billion times each day.
- Over 50% of Instagram accounts use the Explore feature to find new content and accounts, with 83% of users discovering new products and services, and 200 million visiting at least one business profile daily.
- Monthly, 130 million users engage with shopping posts, while over 1 million users watch live videos each day. Carousels surpass both videos and images in organic interactions on Instagram. For best results, captions should ideally be under 10 words and include fewer than 20 emojis.
- Emojis significantly impact engagement. Video posts with 23 emojis see an average engagement rate of 4.95%, while carousels and image posts benefit from 24 and 20 emojis, respectively. Interestingly, brand video posts receive more comments than images.
- Despite 45.7% of Instagram posts featuring questions, there’s no definitive link to increased engagement.
- User engagement typically peaks in the afternoon, especially between 1:00 PM and 5:00 PM.
- “How-to” tutorials are the most popular video content.
- Posts with Geo-location tags receive nearly 80% more engagement compared to those without.
These diverse statistics underscore Instagram’s extensive influence and the varied engagement patterns of its users across different types of content.
Also Read: Top 12 Instagram Viewer Tools Reviewed
Instagram User Demographics
- Instagram’s user base exhibits a balanced gender distribution: 50% male and 50% female. However, the age distribution varies within gender categories:
- In the 25-34 age group, which makes up 30.3% of all users, 16.4% are male and 14.8% are female.
- The 18-24 age group represents 31% of users, with a split of 17.9% male and 13.1% female.
- In the United States, there are 168.6 million Instagram users, with 22.5% falling within the 25-34 age bracket.
- Internationally, a significant 87% of Instagram’s user base resides outside the United States, representing 17.6% of the global population.
- Notably, this suggests that 88% of Instagram’s total user base is international, further highlighting its global reach.
- In the U.S., 73% of teenagers regard Instagram as the most effective platform for marketers.
- Instagram users spend an average of 30 minutes per day on the platform.
- Among U.S. adolescents, 25% consider Instagram their primary social media platform.
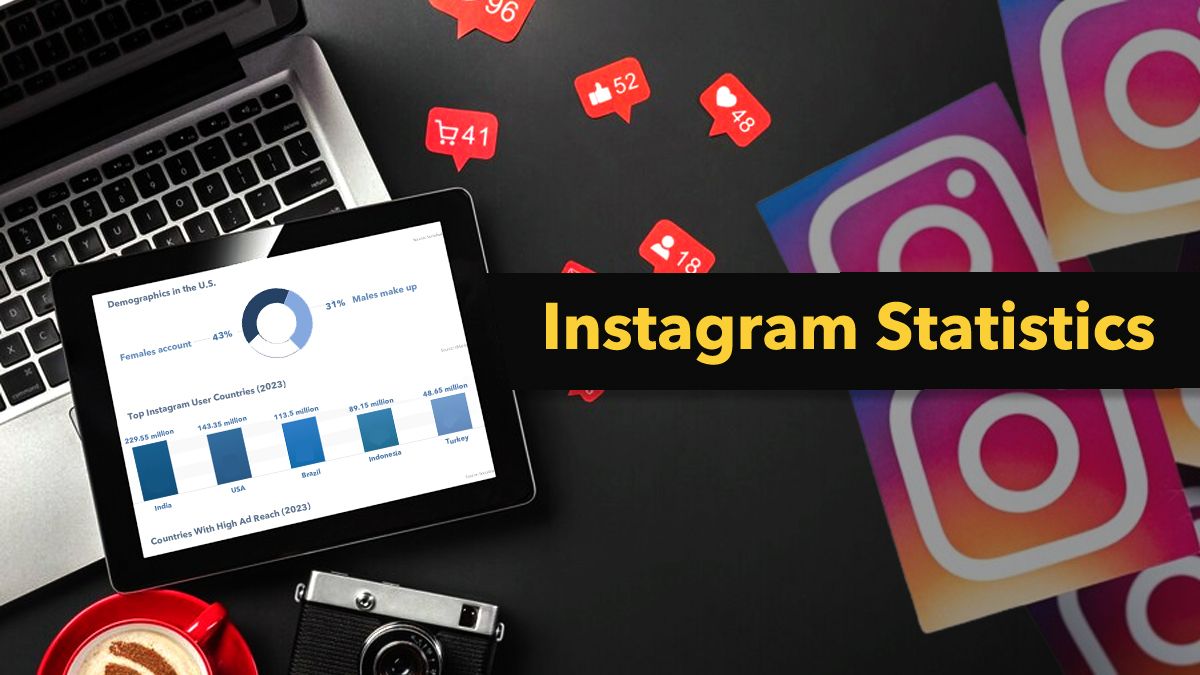
Demographics in the U.S.
- Females account for 43% of Instagram’s user base, while males make up 31%.
- Age-wise, 72% are aged 13-17, 67% are aged 18-29, 47% are aged 30-49, 23% are aged 50-64, and 8% are 65 or older.
- Geographically, 46% of users reside in cities, 35% in suburban areas, and 21% in rural regions.
Top Instagram User Countries (2023)
- India – 229.55 million
- USA – 143.35 million
- Brazil – 113.5 million
- Indonesia – 89.15 million
- Turkey – 48.65 million
- Japan – 45.7 million
- Mexico – 36.7 million
- UK – 28.75 million
- Germany – 27.45 million
- Italy – 26.2 million
Countries With High Ad Reach (2023)
- Bahrain – 88.6%
- Cyprus – 84.3%
- Turkey – 83.2%
- Kazakhstan – 83.1%
- Brunei – 82.6%
- Cayman Island – 80.2%
- UAE – 80.2%
- Chile – 77.6%
- Uruguay – 71.2%
- Kuwait – 76.5%
Also Read: The Best Time to Post on Instagram Reels to Get More Views
Instagram Stories Stats
- Instagram Stories boasts 500 million daily active users.
- A substantial 62% of consumers report increased interest in a brand after seeing it featured in an Instagram Story.
- The heart love sticker is the most frequently used Giphy in Stories.
- Branded stories capture the attention of 15% to 25% of users, especially those actively engaging with embedded links.
- An impressive 70% of Instagram users interact with Stories daily.
- Notably, 86.6% of Instagram users actively share Stories.
- Businesses frequently use Instagram Stories to showcase products, with 36% employing this strategy.
- Additionally, 49% of Gen Z consumers rely on Stories to discover the latest products and services.
- Interestingly, 70% of Instagram Stories are viewed with sound on.
- In terms of reach, brands with a large following achieve a 12% reach rate for posts, while Stories typically see an average reach rate of 2%.
- Unsurprisingly, fashion firms extensively use Instagram, with approximately 98% leveraging its features.
Instagram Reels Stats
- Instagram Reels ads can potentially reach an audience of 758.5 million people.
- Business accounts on Reels typically see a 1.21% interaction rate with their followers.
- The audience demographics for Reels ads consist of 45.0% male and 55.0% female.
- A significant 87% of Gen Z TikTok users, who have also tried Instagram Reels, view Reels as very similar to TikTok.
- The majority of users engaging with Instagram Reels daily or weekly do not consider TikTok to be fundamentally different.
- Notably, 61% of Gen Z TikTok users express a preference for spending more time on Instagram than on TikTok.
Instagram Advertising Stats
- Instagram posts have an average engagement rate of 0.97%.
- Turkey has the highest advertising reach on Instagram, reaching 76.0% of its population aged 13 and older.
- Engagement rates for different post types are: 0.46% for photo posts, 0.61% for videos, and 0.62% for carousel posts.
- Instagram features 2 million ads on its platform each month.
- The estimated advertising reach of Instagram users is 1.60 billion people.
- Instagram has the potential to reach 25.9% of the global population aged 18 and above.
- The gender distribution of Instagram’s advertising audience is balanced, with an equal 50% female and 50% male.
Instagram Ad Audience Stats
- 13 – 17 years old:
- Female – 4.2%
- Male – 4.3%
- 18 – 24 years old:
- Female – 15.4%
- Male – 16.2%
- 25 – 34 years old:
- Female – 13.9%
- Male – 15.6%
- 35 – 44 years old:
- Female – 8%
- Male – 7.3%
- 45 – 54 years old:
- Female – 4.6%
- Male – 3.6%
- 55 – 64 years old:
- Female – 2.6%
- Male – 1.7%
- 65+ years:
- Female – 1.5%
- Male – 1.1%
Instagram Business Engagement Benchmarks
- Aggregate Engagement Rate in 2023: 0.97%
- Photos: 0.59%
- Videos: 0.68%
- Carousel Posts: 0.77%
- Monthly Follower Growth for Business Accounts: +0.70%
- Daily Main Feed Posts for Businesses: 1.77 times
- Main Feed Post Distribution:
- Photos: 43.7%
- Carousels: 20%
- Videos: 31.8%
- Monthly Stories Shared by Business Accounts: 13.1
- Engagement Rates by Follower Count:
- Less than 10,000 followers: 1.51%
- 10,000 to 100,000 followers: 0.93%
- Over 100,000 followers: 0.78%
Note: Smaller business accounts with fewer than 10,000 followers achieve an impressive average post engagement rate of 1.51%, surpassing their larger counterparts.
Instagram Brand Stats
- A striking 90% of Instagram accounts follow at least one business.
- In the upcoming 12 months, 67% of marketers plan to increase their organic efforts on Instagram.
- On average, brands post 2.5 stories per week.
- 60% of brands incorporate interactive elements like polling stickers, mentions, and music into their stories on a weekly basis.
- Brand stories on Instagram have an impressive 85% completion rate.
- A recent survey reveals that 78% of users perceive brands on Instagram as popular, 77% as creative, 76% as entertaining, and 72% as committed to community building.
- User-generated content (UGC) is trusted by 92% of Instagram users more than traditional advertising.
- UGC influences the purchasing decisions of 81% of users.
- Instagram-savvy brands typically post 11-20 times per month.
- Comments on posts from 10% of brands emerge after an average of 19 days.
- A whopping 98% of fashion brands maintain a presence on Instagram.
- Half of all Instagram brands have created at least one story.
- Brands experience approximately 10 times more engagement on Instagram compared to Facebook.
- For the same image, brands may see a 23% lower engagement rate on Facebook.
- A significant 89% of marketers consider Instagram the most important platform for influencer marketing.
In terms of influencer campaigns:
- 79% of brands leverage Instagram.
- Facebook follows with 46%.
- YouTube stands at 36%.
- Twitter trails at 24%.
- LinkedIn lags behind at 12%.
Most Followed Instagram Accounts
- Instagram – 665,000,000
- Cristiano Ronaldo – 615,000,000
- Lionel Messi – 496,000,000
- Selena Gomez – 429,000,000
- Kylie Jenner – 399,000,000
- Dwayne “The Rock” Johnson – 395,000,000
- Ariana Grande – 380,000,000
- Kim Kardashian – 364,000,000
- Beyonce – 319,000,000
- Khloe Kardashian – 311,000,000
Stats About Hashtags
- Using just one hashtag in a post can increase interactions by 29%.
Employing more than 11 hashtags can lead to a 79% boost in interactions.
- Longer hashtags, particularly those with 21 to 24 characters, typically outperform shorter ones.
- Approximately 7 out of every 10 hashtags on Instagram are brand-related.
Frequently Used Hashtags:
- #love (2.1B)
- #instagood (1.6B)
- #instagram (1.1B)
- #art (1B)
- #photooftheday (1B)
- #photography (1B)
- #beautiful (823M)
- #picoftheday (720M)
- #happy (698M)
- #follow (695M)
Conclusion
In summary, the Instagram statistics for 2025 offer a detailed glimpse into the platform’s evolving dynamics. As Instagram adapts to changing user preferences and technological advancements, several key trends have become apparent. These include the emergence of new features and content formats, as well as shifts in user demographics and engagement patterns.
These insights are crucial for content creators, marketers, and users to make informed decisions, refine strategies, and maintain a competitive edge in the dynamic digital world. With Instagram’s continued prominence in social media, these statistics are invaluable for understanding its current state and predicting future trends.
FAQs
What is the current trend in user-generated content on Instagram?
User-generated content remains a dominant trend on Instagram in 2025. This content type is extensively utilized by brands and individuals for marketing and promotional purposes, fostering a sense of authenticity and community on the platform.
What is the impact of IGTV and Instagram Reels on video content consumption?
IGTV and Instagram Reels have significantly influenced the consumption of video content on Instagram. These features have spurred an increase in both short-form and long-form video consumption, offering creators a variety of ways to express their content.
How has Instagram responded to societal and cultural shifts, promoting inclusivity and well-being?
Instagram has proactively addressed societal and cultural shifts by focusing on inclusivity and well-being. The platform has launched initiatives [mention specific initiatives here if known] to reflect its commitment to fostering a positive and supportive online community.
What are the emerging trends in content types on Instagram?
Emerging content trends on Instagram include a mix of short-form videos, reels, and interactive content like polls and quizzes. Influencer collaborations and authentic, visually compelling content are expected to continue being popular.
